


| ||||||||
|
|
|
|
|
|
|||
|
the project
observing schedule
The coordinates of the CDFS and UDS fields dictate that all VANDELS observations must take place between August and January each year. The first observations for VANDELS were obtained in mid-November 2014, and the survey will undertake its first full observing season between Aug 2015 and Jan 2016. The provisional 4-year schedule for VANDELS should see the final observations taken in January 2019. A full discussion of the scheduling can be found in the VANDELS survey management plan
the data
VANDELS is an ESO public survey and, as such, all of the raw data is immediately available via the ESO archive. In addition, the VANDELS team has undertaken to deliver fully reduced data products to the astronomy community on a regular basis. The first VANDELS data release is provisionally scheduled for September 2016, with further data releases scheduled at yearly intervals thereafter. All data products will be published via the ESO archive and this website. A full description of the VANDELS data products and data release schedule can be found in the VANDELS survey management plan
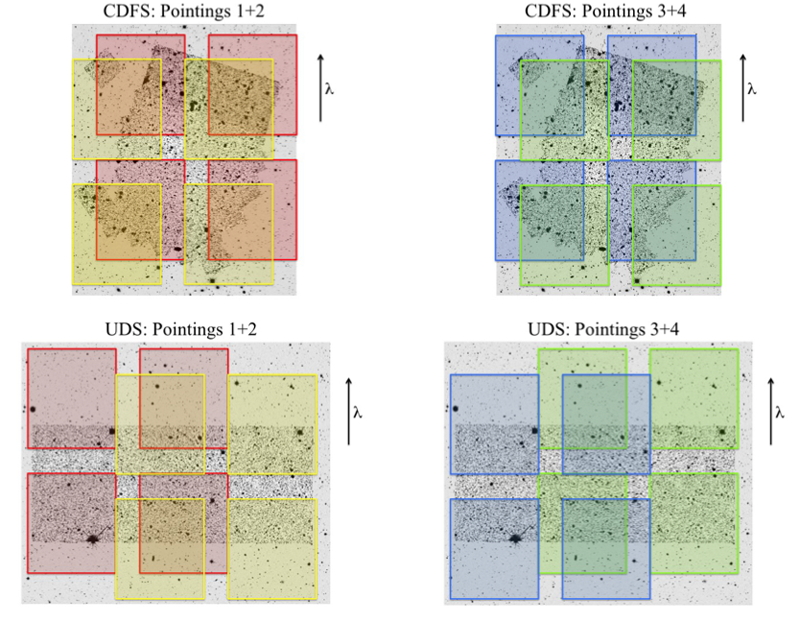
Fig. 1 Layout of the proposed VANDELS pointings (4 in UDS and 4 in CDFS). In each figure the VIMOS quadrants of a given pointing are shown as a different colour, overlaid on a greyscale image showing the available HST H-band imaging (centre) and wider-area, ground-based, H-band imaging. The quality of the multi-wavelength data available over the wider UDS and CDFS fields is excellent, and more than sufficient to select HAB<24 targets over the full VANDELS footprint. The pointings are placed to ensure that each VIMOS quadrant always intersects the CANDELS HST imaging which, due to the high surface density of
faint z≥3 galaxies, allows us to maximize the number of slits in the central HST area.
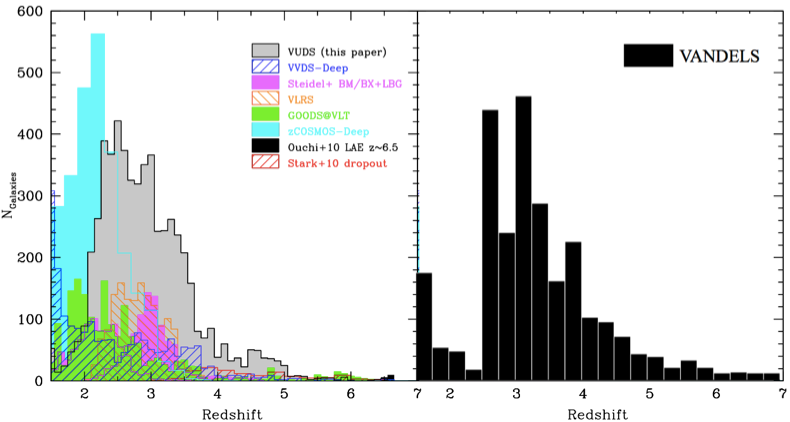
Fig 2. A comparison between the expected VANDELS redshift distribution and those of previous high-redshift spectroscopic surveys. The LHS panel shows the redshift distribution of the VIMOS Ultra Deep Survey (VUDS) within the context of other notable spectroscopic surveys (taken from Le Fevre et al. 2014). It is clear that even VUDS has a redshift distribution which is strongly peaked at z=2.5-3, with only a small fraction of galaxies at z>4 and only 26 galaxies in total at z≥5. The RHS panel shows the expected redshift distribution of VANDELS, based on photometric redshifts derived from the multi-wavelength data available in the CDFS and UDS fields. The VANDELS selection function should ensure that ~20% of the final sample are at z≥4, with ~200 galaxies at z≥5.
|